Geração de gráficos com JFreechart
Warning: WP_Syntax::substituteToken(): Argument #1 ($match) must be passed by reference, value given in /home/feltexco/public_html/felix/wp-content/plugins/wp-syntax/wp-syntax.php on line 380
Warning: WP_Syntax::substituteToken(): Argument #1 ($match) must be passed by reference, value given in /home/feltexco/public_html/felix/wp-content/plugins/wp-syntax/wp-syntax.php on line 380
Warning: WP_Syntax::substituteToken(): Argument #1 ($match) must be passed by reference, value given in /home/feltexco/public_html/felix/wp-content/plugins/wp-syntax/wp-syntax.php on line 380
Warning: WP_Syntax::substituteToken(): Argument #1 ($match) must be passed by reference, value given in /home/feltexco/public_html/felix/wp-content/plugins/wp-syntax/wp-syntax.php on line 380
Geração de gráficos com JFreechart
Olá amigos,
Existem muitas situações que precisamos fazer apresentações de resultados de forma resumida e na forma de gráfico. Neste momentos temos que conhecer as ferramentas certas e suas características para podermos ter um bom resultado do nosso trabalho. Hoje apresentaremos uma forma de gerar gráficos em Java e para isso utilizaremos o framework JFreeChart.
Montagem do ambiente
Vamos iniciar com a montagem do ambiente. Nós precisaremos de 2 arquivos: jcommon-1.0.23.jar e jfreechart-1.0.19.jar
Eles estão disponíveis no arquivo compactado disponível aqui: “http://sourceforge.net/projects/jfreechart/files/1.%20JFreeChart/1.0.19/”
Ao fazer o download descompacte o arquivo e você poderá encontrar os arquivos informados na pasta “lib”. Em seguida copie-os para a pasta lib do seu projeto.
Como o nosso projeto será um projeto Web crie um servlet chamado “GeracaoGraficoServlet”.
1 | Mais informações de como criar um projeto Web <a href="http://www.feltex.com.br/felix/alo-mundo-java-web-eclipse/" title="Alô Mundo Java Web – Eclipse">aqui</a> |
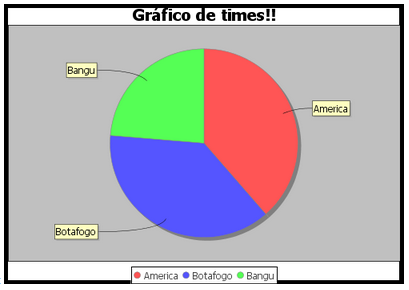
1 2 3 4 5 6 7 8 9 10 11 12 13 14 15 16 17 18 19 20 21 22 23 24 25 26 27 28 29 30 31 32 33 34 35 36 37 38 39 40 41 42 43 44 45 46 47 48 49 50 51 52 53 54 55 56 57 58 59 60 61 62 63 64 65 66 67 68 69 70 71 72 73 74 | package br.com.feltex.jfreechart.jee; import java.awt.BasicStroke; import java.awt.Color; import java.io.IOException; import java.io.OutputStream; import javax.servlet.ServletException; import javax.servlet.annotation.WebServlet; import javax.servlet.http.HttpServlet; import javax.servlet.http.HttpServletRequest; import javax.servlet.http.HttpServletResponse; import org.jfree.chart.ChartFactory; import org.jfree.chart.ChartRenderingInfo; import org.jfree.chart.ChartUtilities; import org.jfree.chart.JFreeChart; import org.jfree.chart.entity.StandardEntityCollection; import org.jfree.data.general.DefaultPieDataset; import org.jfree.data.general.PieDataset; /** * Servlet implementation class GeracaoGrafico */ @WebServlet("/GeracaoGraficoServlet") public class GeracaoGraficoServlet extends HttpServlet { private static final long serialVersionUID = 1L; public GeracaoGraficoServlet() { super(); } protected void doGet(HttpServletRequest request, HttpServletResponse response) throws ServletException, IOException { doPost(request, response); } private PieDataset carregarDados() { // Geração de dados aleatórios double valor1 = (Math.random() * 45); double valor2 = (Math.random() * 45); double valor3 = 10; if ((valor1 + valor2 + valor3) < 100) { valor3 = (100 - (valor1 + valor2)); } DefaultPieDataset result = new DefaultPieDataset(); result.setValue("America", valor1); result.setValue("Botafogo", valor2); result.setValue("Bangu", valor3); return result; } protected void doPost(HttpServletRequest request, HttpServletResponse response) throws ServletException, IOException { try { JFreeChart chart = ChartFactory.createPieChart("Gráfico de times!!", carregarDados(), true, true, false); chart.setBorderPaint(Color.black); chart.setBorderStroke(new BasicStroke(10.0f)); chart.setBorderVisible(true); if (chart != null) { int width = 500; int height = 350; final ChartRenderingInfo info = new ChartRenderingInfo(new StandardEntityCollection()); response.setContentType("image/png"); OutputStream out = response.getOutputStream(); ChartUtilities.writeChartAsPNG(out, chart, width, height, info); } } catch (Exception e) { e.printStackTrace(); } } } |
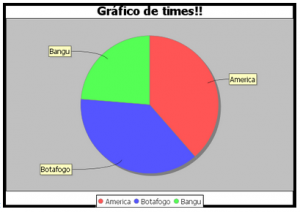
Crie em seu projeto uma página “chamada index.jsp”. Abaixo temos o código da página que chamará o servlet com o gráfico. Cria uma
1 2 3 4 5 6 7 8 9 10 11 12 | <html> <head> <meta http-equiv="refresh" content="5"> <!-- O gráfico será gerado a cada 5 segundos--> </head> <body> <div> O gráfico será gerado a cada 5 segundos: <img src="GeracaoGraficoServlet" alt="Progress chart" /> </div> </body> </html> |
Pronto. Agora é só executar o seu projeto no servidor de aplicação. Neste exemplo utilizei o Tomcat 8. Caso tenha alguma dúvida veja como instalar e configurar esse servidor
aqui
Há também a possibilidade de utilizar o JFreechart em aplicações JavaSE. Veja um exemplo abaixo:
Podemos também utilizar o JFreeChart na geração de gráficos para o ambiente desktop JSE. Veja o exemplo abaixo.
1 2 3 4 5 6 7 8 9 10 11 12 13 14 15 16 17 18 19 20 21 22 23 24 25 26 27 28 29 30 31 32 33 34 35 36 37 38 39 40 41 42 43 44 45 46 47 48 49 50 51 52 53 54 55 56 57 58 59 60 61 62 63 64 65 66 67 68 69 70 71 | package br.com.feltex.jfreechart.jse; import javax.swing.JFrame; import org.jfree.chart.ChartFactory; import org.jfree.chart.ChartPanel; import org.jfree.chart.JFreeChart; import org.jfree.chart.plot.PiePlot3D; import org.jfree.data.general.DefaultPieDataset; import org.jfree.data.general.PieDataset; import org.jfree.util.Rotation; public class GeracaoGrafico extends JFrame { private static final long serialVersionUID = 1L; public static void main(String[] args) { GeracaoGrafico demo = new GeracaoGrafico("Times", "Comparação de times!"); demo.pack(); demo.setVisible(true); } public GeracaoGrafico(String applicationTitle, String chartTitle) { super(applicationTitle); PieDataset origemDados = carregarDados(); JFreeChart grafico = criarGrafico(origemDados, chartTitle); ChartPanel chartPanel = new ChartPanel(grafico); chartPanel.setPreferredSize(new java.awt.Dimension(500, 270)); setContentPane(chartPanel); } /** * Carregamento dos dados */ private PieDataset carregarDados() { // Geração de dados aleatórios double valor1 = (Math.random() * 45); double valor2 = (Math.random() * 45); double valor3 = 10; if ((valor1 + valor2 + valor3) < 100) { valor3 = (100 - (valor1 + valor2)); } DefaultPieDataset result = new DefaultPieDataset(); result.setValue("America", valor1); result.setValue("Botafogo", valor2); result.setValue("Bangu", valor3); return result; } /** * Criação do gráfico * */ private JFreeChart criarGrafico(PieDataset origemDados, String titulo) { JFreeChart chart = ChartFactory.createPieChart3D(titulo, origemDados, true, // Adicionar // Lengenda true, false); PiePlot3D plot = (PiePlot3D) chart.getPlot(); plot.setStartAngle(290); plot.setDirection(Rotation.CLOCKWISE); plot.setForegroundAlpha(0.5f); return chart; } } |
Links relacionados
http://www.jfree.org/jfreechart/
Configuração do Eclipse
Deixe um comentário
Você precisa fazer o login para publicar um comentário.